A Foundation Built On Sound Strategy
- Disciplined Acquisitions
- Redevelopment & Development
- Property Management
• Integrate market information to identify underperforming assets in high-demand areas, limiting downside risk and increasing potential upside.
• Utilize institutional approach to an unsophisticated market with analytical/property selection and immense local market knowledge.
• Strong existing broker and landlord relationships offer direct access to off-market deals.
• Proven comprehensive construction and project management experience utilizing deep relationships with existing and trusted contractors.
• Continual upgrade of assets throughout the holding period to achieve full potential.
• Strategic modernization of original aesthetic with new finishes, while repurposing once wasted space into income-generating areas
• Deploy deep expertise to quickly identify underlying causes that undervalue assets.
• Drive financial performance through aggressive leasing and expense control with state-of-the-art technology to reduce operating costs.
• Execute leasing strategies with affiliated property management team, Rosano Property Management.
We’re Built Differently.
- Large Real Estate Private Equity Funds Often Generate Poor Returns
- Smaller Funds Exploit Market Inefficiencies
- Smaller Funds Charge Lower Fees and Better Align with LP Interests
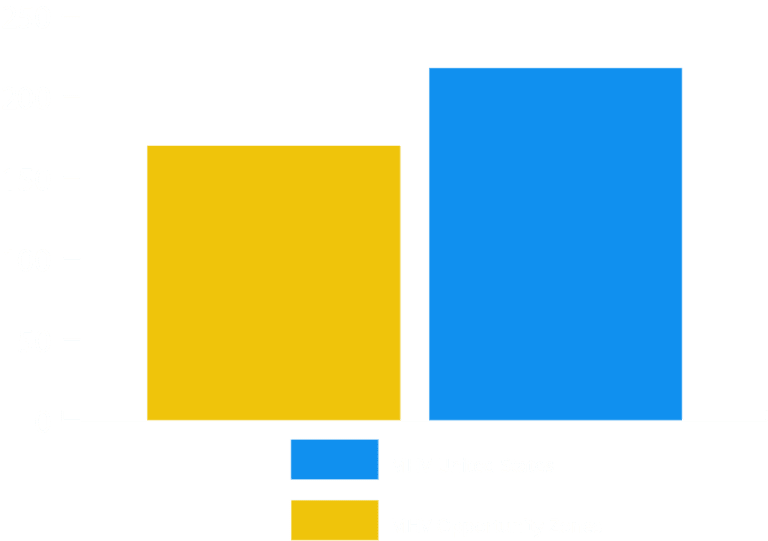
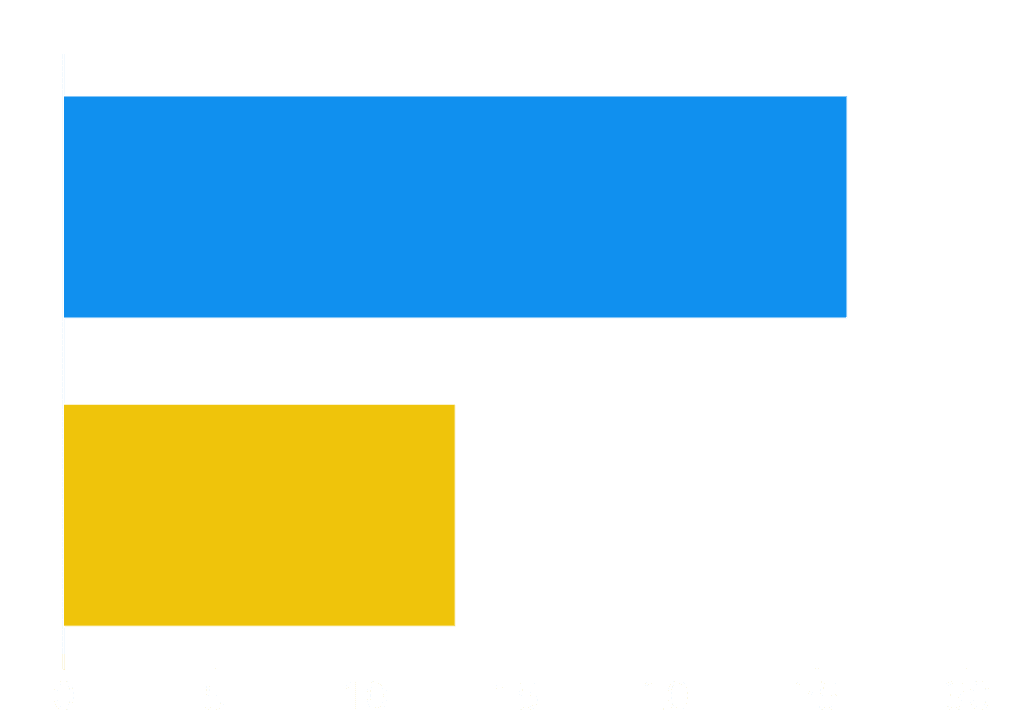
• According to Prequin ROI data, real estate funds with at least $1bn in assets generated an average net internal rate of return of 5.7%, while funds with at most $200mm net IRR of 11.2%.
• Larger managers focus on building assets under management because their allegiance is to shareholders, not fund investors.
• In contrast, a small manager’s allegiance is to LPs, and its goal is to build a strong track record.
• In private markets, the lower end is less efficient than the higher end, allowing smaller managers to deliver higher active returns.
• Private funds that focus on smaller deal sizes are more likely to find and exploit pricing mistakes and anomalies.
• Greater information asymmetries in addition to less technical analyses can lead to wider bid-ask spreads, creating opportunities for off-market purchases and high returns in marketed properties.
• Real estate is local — a global real estate fund may not have the ground-level expertise to uncover market opportunities in acquisitions, marketing, or property management.
• Two layers of fees: a fund’s size influences not only its strategic priorities but also its ability to efficiently invest capital. A large fund with billions of dollars must rely on the platforms of other managers to deploy those funds. This double layer of fees often leads to large fund underperformance.
Roman Fund I
$50mm
Stakeholders:
Individual investors and family offices seeking tax relief, tax planning, and generational planning.
Target:
Invests in supply constrained, demand positive West Coast Urban Areas.
What Are Opportunity Zones?
Opportunity Zone Funds were created by the 2017 Tax Cuts and Jobs Act with the purpose
of uplifting low-income communities throughout the United States.
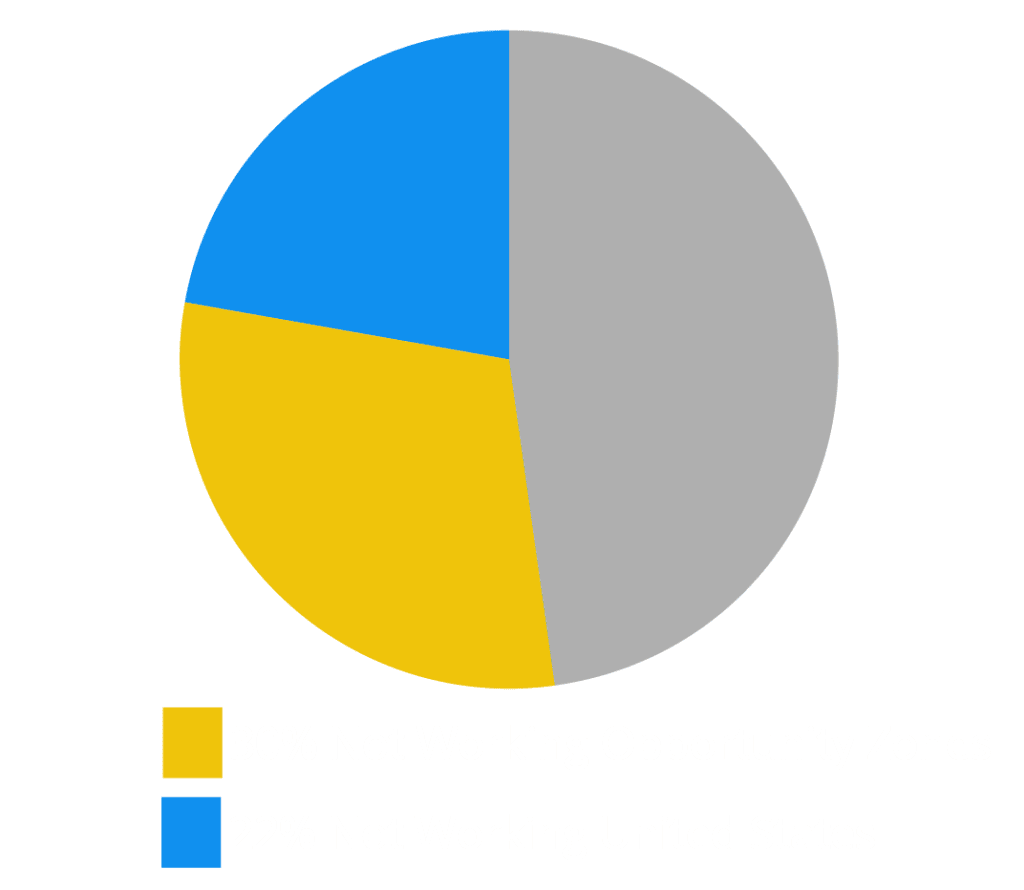
• Approximately 35.2 million people, or 11% of the U.S. population, currently live in opportunity zones.
• Zones were chosen by governors in qualified low-income census tracts—identifying the most distressed areas.
• Current poverty rate within Opportunity Zones is around 31%, with a median household income of $33,345.
• CEA estimates that $75 billion has been raised in private capital ($52 billion in new investment).
• CEA estimates that Opportunity Zones may lift about 1 million people out of poverty.
Previous
Next
Opportunity Zone is 2/3 the national MFI.
The average poverty rate in an Opportunity
Zone is double the national poverty rate.
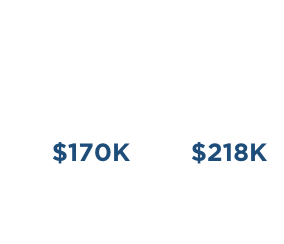
The average median home value (MHV)
in an Opportunity Zone is $48K lower
than U.S. home value.
Close to a third of prime age adults in the
average Opportunity Zone are not working.
28% of Opportunity Zones are food deserts,
according to data from the U.S. Department
of Agriculture.

More than half of the country’s persistent
concentrated poverty* census tracts are
Opportunity Zones.

*Greater than 40 percent poverty rate in 1980 and 2019
The Roman Approach

- Above average risk-adjusted returns through opportunistic acquisitions and management strategies.
- Value-add opportunities, including development, renovation, and repositioning to improve operational efficiencies and increase revenue.
- Acquire challenging properties with extraordinary potential at below-market prices.
OZ Investor Benefits
Capital Raise Period
12-18 months
Capital Deployment Period
24 months
Manager’s Investment
1.0% of the Fund, not to exceed $1million
Minimum Investment
HNW Individuals & Family Offices: $100,000
Institutional Investors: $5 million
Targeted Returns
Project IRR: 17% – 20%
Equity Multiple: 2.5x – 3.0x
Preferred Return
7% preferred return (cumulative; non-compounding) to Limited
Partners (LPs); 70% to LPs and 30% to the General Partner (GP)
after that
Target Hold Period
Non-OZ Fund: Seven to ten years; Proceeds from the sale of properties held less than ten years may be reinvested within the Fund.